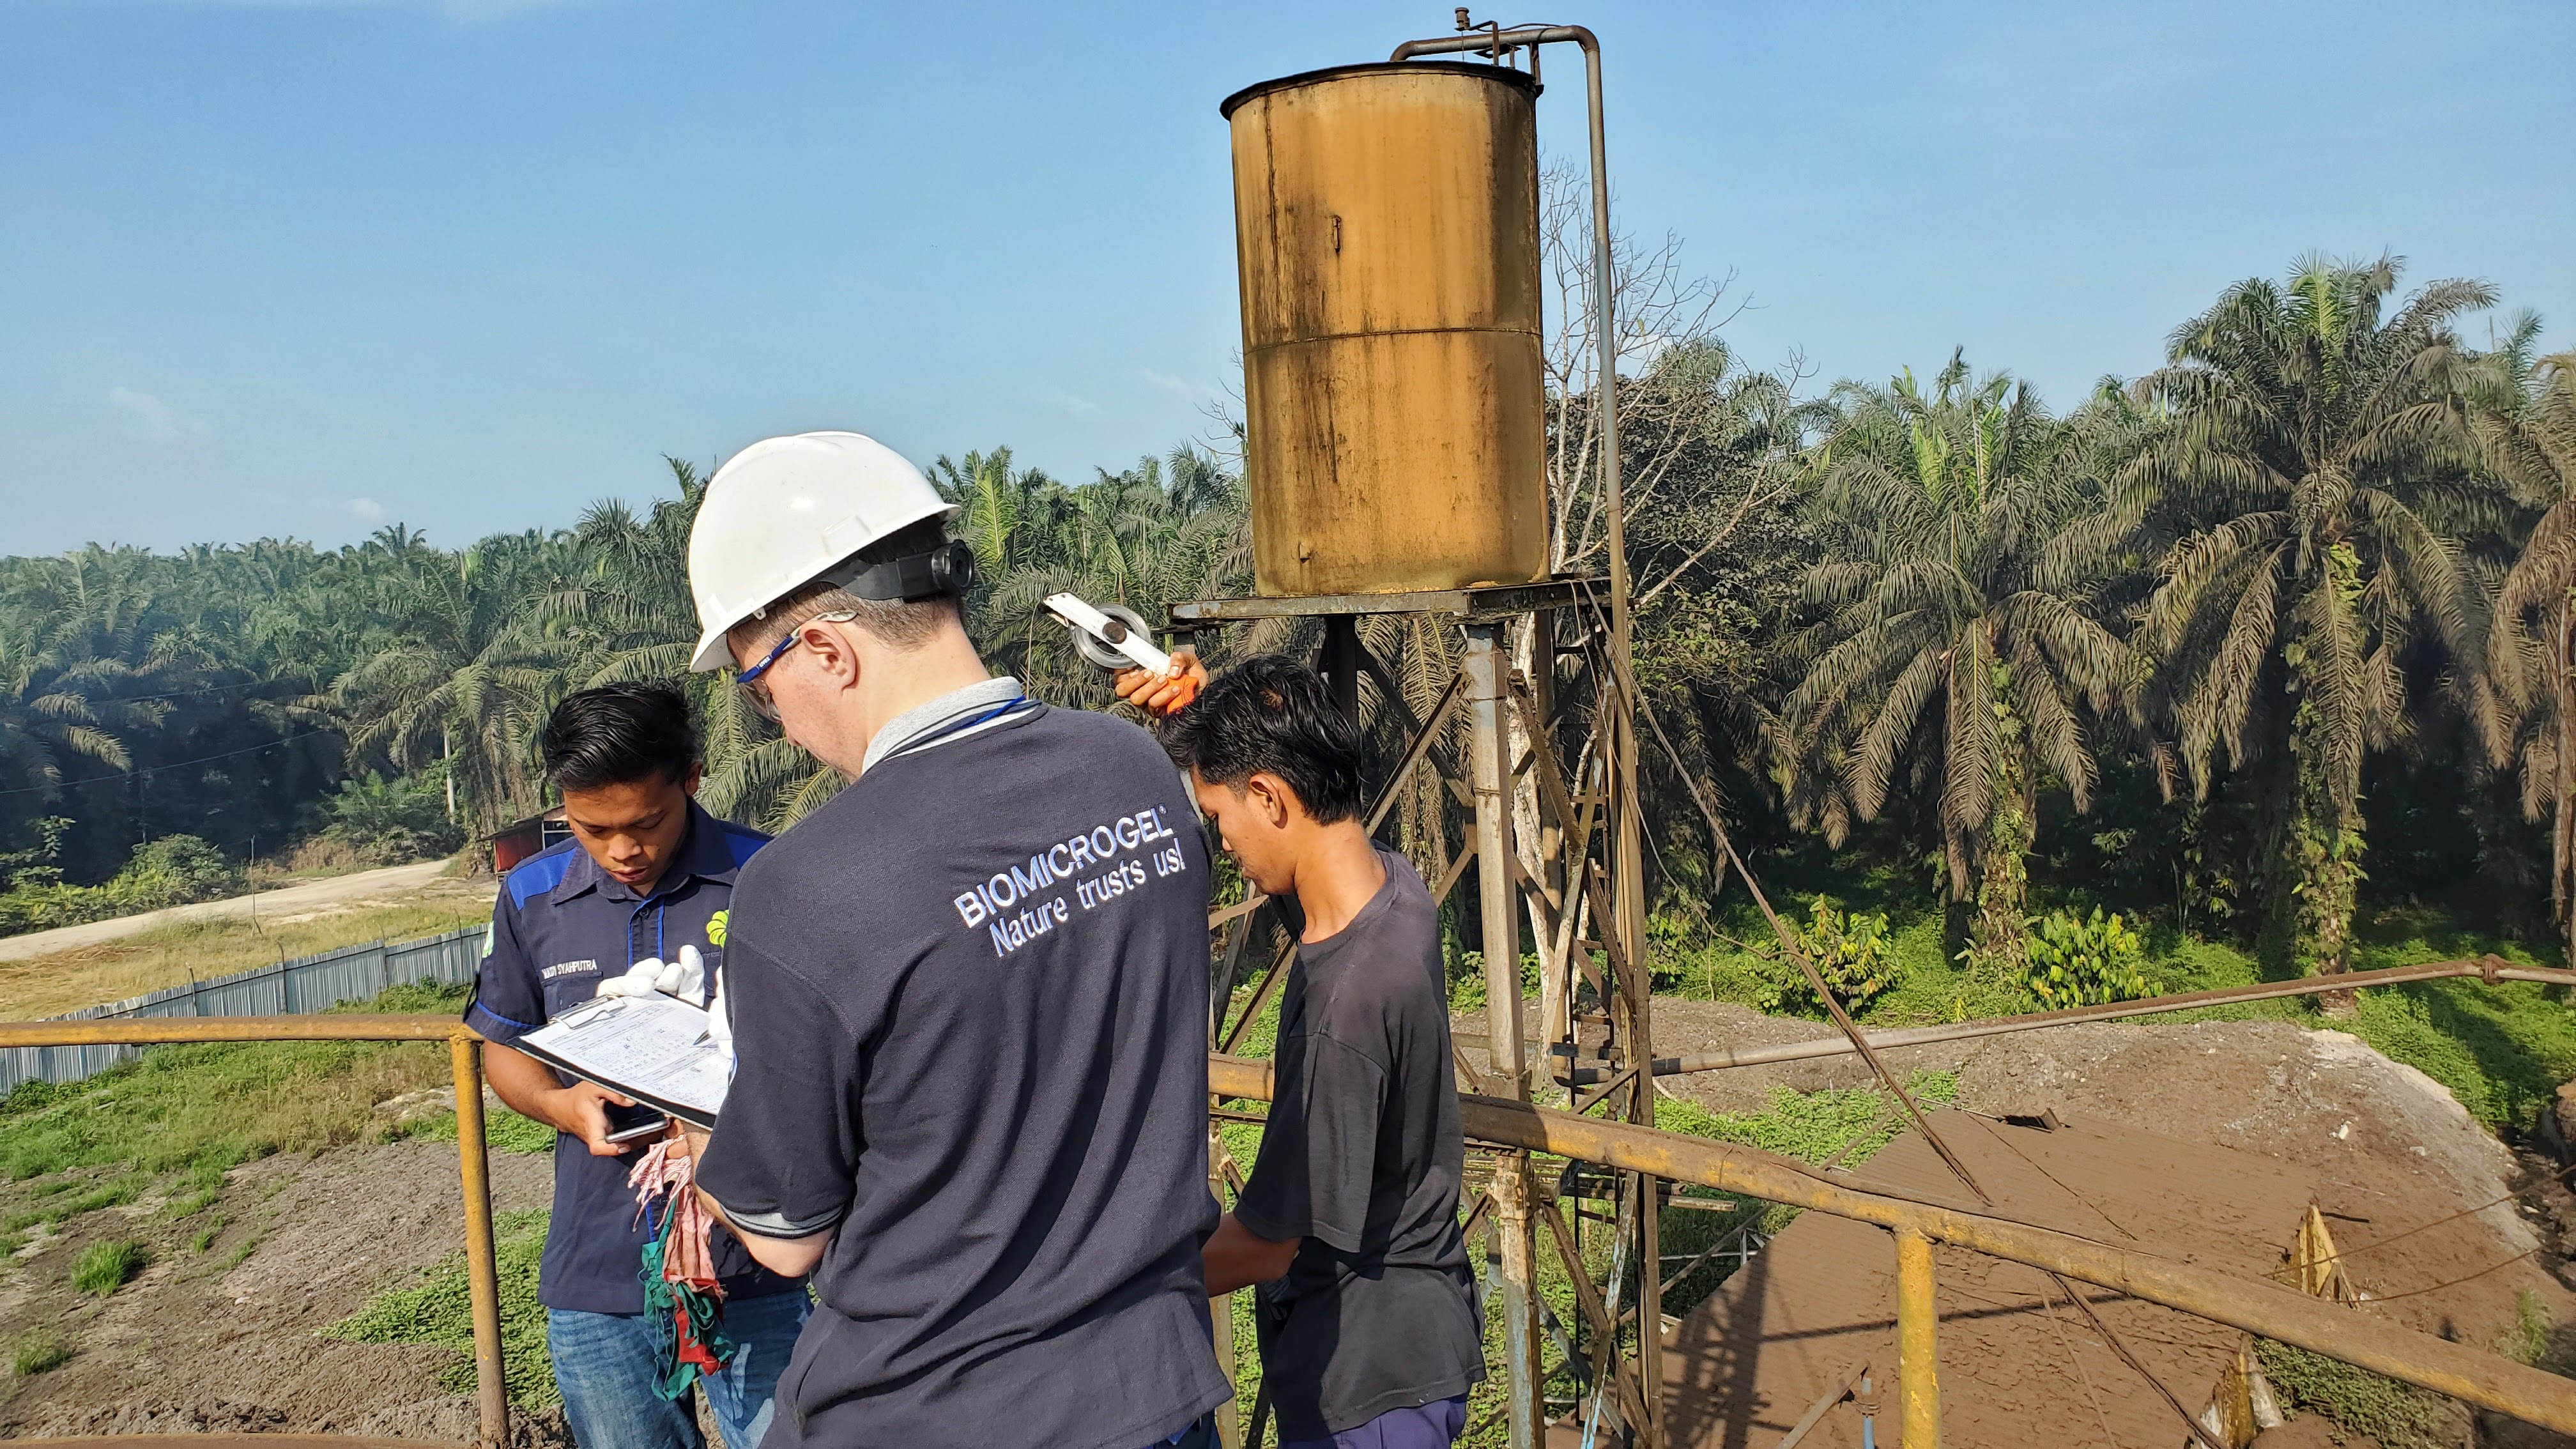
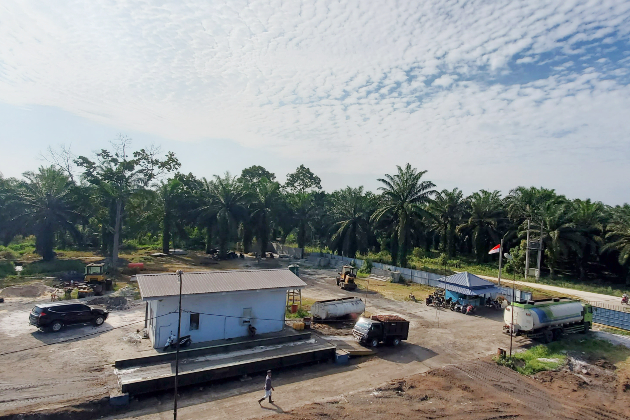
If you already have sufficient knowledge of palm oil extraction and understand your mill’s performance — fill in the data in our calculator to estimate the potential economic benefits of using Biopolymer technologies products. This article will help you understand the parameters we use for calculating benefits and their impact on the final results.
03/10/2025
Palm oil extraction is a complex process that consists of several steps, which we discuss in detail in our article. At each stage, it’s crucial to monitor metrics that can increase oil extraction rate (OER), minimize oil loss and reduce emulsion in the underflow.
The calculator is only a technical tool on our website that helps to estimate how much additional oil you can get after applying our reagent.
We’ve used the average data based on our experience of implementing reagents in palm oil mills. Let’s take a closer look at each metric.

OER is calculated by the formula:
OER = CPO/FFB⋅100%,
where CPO is the amount of palm oil produced by the mill in a year, FFB is the amount of palm fruit processed by the mill in a year.
The OER for most mills in Indonesia is in the range of 20–23%, for Malaysia it’s the range of 19–22%. This figure depends on the quality of FFB, condition of processing equipment and other factors.
An OER above 23% is considered good, indicating efficient processing of FFB by the mill.
Crude Oil Tank — the tank from which palm oil is delivered to the Continuous Settlig Tank (CST) for extraction.
Oil content in COT is measured in the laboratory by centrifugation. This indicator is checked once every 2–3 hours and is usually in the range of 30–40%. This indicator shows how much virgin oil has been diluted with water. It is used to calculate the reagent dosage.
Biopolymer technologies reagent helps to reduce the dilution of virgin oil with water and to increase the oil content in the COT up to 40% without increasing losses in the clarification stage. As a result, water consumption can be reduced by 50%.
The working hours per day is used to calculate the average FFB, TPH.


Most of the parameters are calculated based on the mill's performance per hour, day, month or year. They help to evaluate the productivity of the mill and to estimate the amount of additional oil that can be obtained after applying the reagent.
The EVA is calculated from the resulting additional oil per year.
EVA is calculated by the formula:
EVA = ((Additional Oil cost – reagent cost))/(reagent cost)
Biopolymer technologies reagent brings attractive EVA in two ways:
Submit a request on our website, and we’ll provide a detailed explanation of the calculations and help you make them more accurate.
The calculator is only a technical tool on our website that helps to estimate how much additional oil you can get after applying our reagent.
We’ve used the average data based on our experience of implementing reagents in palm oil mills. Let’s take a closer look at each metric.
The text in the white box can be changed. Enter your data and the calculator will automatically recalculate the benefit in percentages and USD.

- Capacity FFB, TPH
- Average FFB, tn/day
- Current Average OER, %
OER is calculated by the formula:
OER = CPO/FFB⋅100%,
where CPO is the amount of palm oil produced by the mill in a year, FFB is the amount of palm fruit processed by the mill in a year.
The OER for most mills in Indonesia is in the range of 20–23%, for Malaysia it’s the range of 19–22%. This figure depends on the quality of FFB, condition of processing equipment and other factors.
An OER above 23% is considered good, indicating efficient processing of FFB by the mill.
- Oil content in COT (CST input)
Crude Oil Tank — the tank from which palm oil is delivered to the Continuous Settlig Tank (CST) for extraction.
Oil content in COT is measured in the laboratory by centrifugation. This indicator is checked once every 2–3 hours and is usually in the range of 30–40%. This indicator shows how much virgin oil has been diluted with water. It is used to calculate the reagent dosage.
Biopolymer technologies reagent helps to reduce the dilution of virgin oil with water and to increase the oil content in the COT up to 40% without increasing losses in the clarification stage. As a result, water consumption can be reduced by 50%.
- Working hours per day, h
The working hours per day is used to calculate the average FFB, TPH.
- Working days a year, day
- CPO price, USD/tn
The text in the grey box cannot be changed. Here are parameters from our experience and palm oil mill stats to make calculations.

- OER increase, p.p
- Reagent dosing rate, g/l and its concentration, %
- Reagent price, USD/kg
The green box shows the calculations based on the data you gave above (capacity, average OER, oil content in COT etc.).

Most of the parameters are calculated based on the mill's performance per hour, day, month or year. They help to evaluate the productivity of the mill and to estimate the amount of additional oil that can be obtained after applying the reagent.
- CPO, tn/year
- Additional CPO, tn/ year
The EVA is calculated from the resulting additional oil per year.
- Economic Value Added (EVA) with reagent dosing
EVA is calculated by the formula:
EVA = ((Additional Oil cost – reagent cost))/(reagent cost)
- Profit, USD/year
Biopolymer technologies reagent brings attractive EVA in two ways:
- By increasing OER — extracting more oil from the same amount of FFB without extending retention time.
- By boosting mill productivity — processing more FFB per hour by reducing retention time in the CST.
Submit a request on our website, and we’ll provide a detailed explanation of the calculations and help you make them more accurate.
Other news
Cookies
We use cookies to optimize and continuously improve our website for individual users like you. Please consult our “Cookies policy” to learn more about how they are used on our website.


